


Advanced Building Portfolio Analytics
The EnergyReports™ Analytics Edition helps you make faster, data-driven building energy management decisions by providing advanced analytics, machine learning, and actionable insights to reduce costs, save time, and forecast and track performance. The EnergyReports Analytics Edition builds upon the EnergyReports Dashboards Edition by adding several key analysis and visualization capabilities for advanced energy management across your building portfolio.
Find savings in scheduling, peak-demand, and drift inefficiencies:
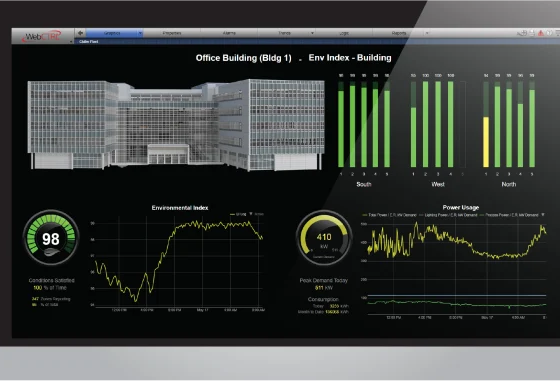
- Minimize peak demand charges by staying on top of load profile and trending analysis to eliminate offending events.
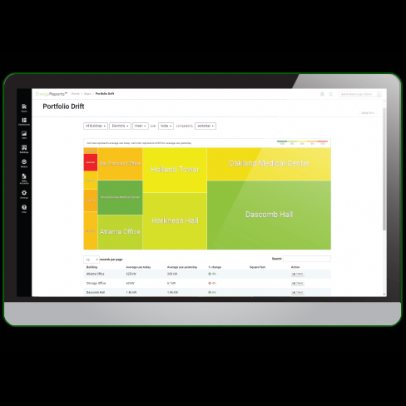
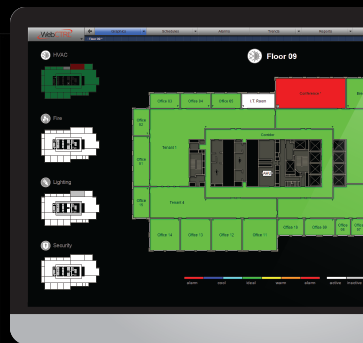
- Identify scheduling inefficiencies with heat maps, or fluctuating building energy trends with drift maps, created with real-time data.
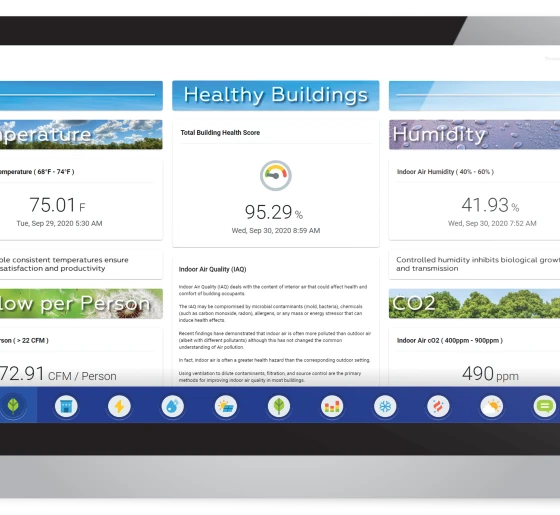
- Dig deep into the performance of a single building or across your aggregated portfolio.
- Share your reports and insights easily with others through shared dashboards, scheduled emails, and data exports.
Reviews
There are no reviews yet.