ENGAGE YOUR OCCUPANTS IN YOUR SUSTAINABILITY STORY
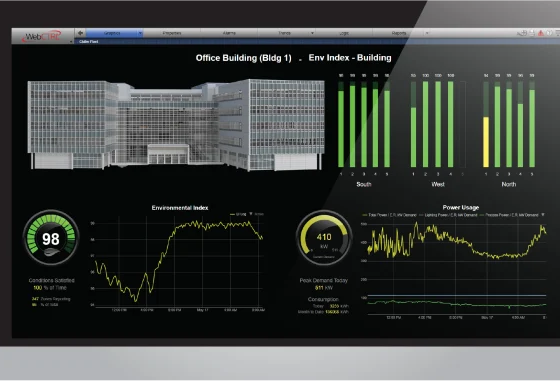
The EnergyReports™ Dashboards Edition leverages the WebCTRL® building automation system to deliver a 360-degree view of building performance so stakeholders can meet their energy conservation and savings objectives. Building upon the EnergyReports EcoScreen Edition, the EnergyReports Dashboards Edition allows operators to create graphs, charts, reports and dashboards to visualize building data, enabling them to:
- Gain insights that help drive energy conservation measures
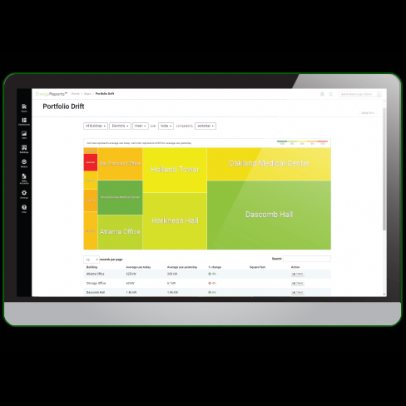
- Create your own energy dashboards using our simple drag-and-drop tools to analyze and share your data in unique ways
- Simplify utility reporting and distribute reports across departments with shared data with key stakeholders
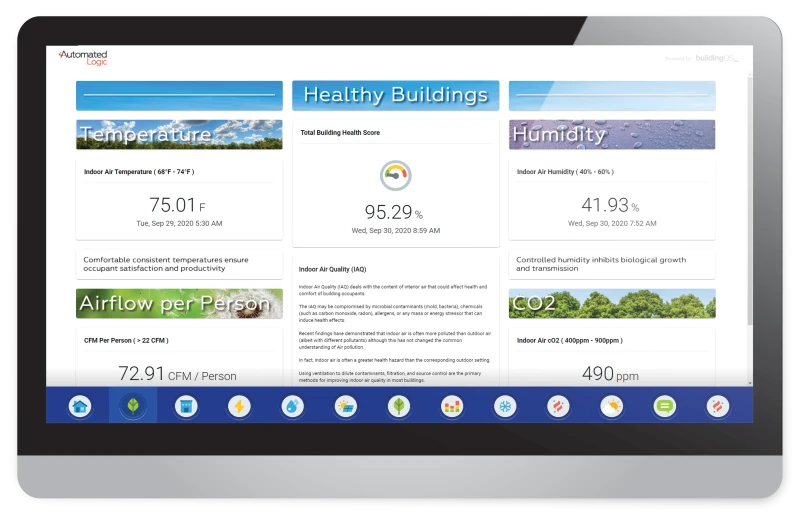
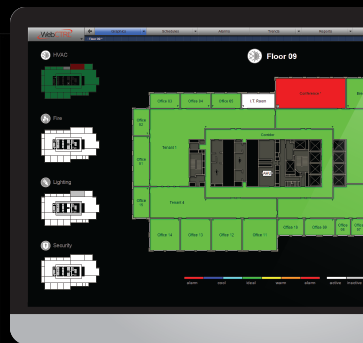
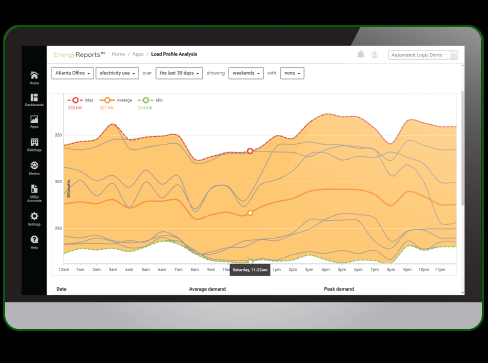
- Bring data to life with interactive and intuitive visualizations that provide value to anyone in the organization
- Visualize trends over time, understand what is driving your costs, and verify the accuracy of your monthly bills
- Manage data collection of utility bills for analysis
Reviews
There are no reviews yet.