Every Smart Building Needs a Cornerstone

A proven, industry-leading system, the WebCTRL® building automation system gives you the ability to fully understand your operations and analyze the results with tools that make sense to you.

Look at your building automation system as the gathering place, the repository of all operating data and information related to your building. Whether it is temperature history, utility metering, trend data or comfort measurement, your WebCTRL system effectively packages the information you need for management of your facilities — all without the need for third-party monitoring or subscription services.

Features

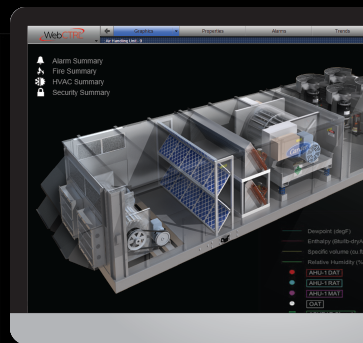
  • Intuitive Graphical Control – The WebCTRL building automation system offers users efficiency and productivity all in one streamlined interface. Our system converts building data into powerful visualizations that can be interpreted quickly – so operators can act quickly. As a result, our system can keep occupants more comfortable, safe and secure, while optimizing building operations.
  • Thermographic Floor Plans – Rather than interpreting setpoints and calculations, Automated Logic thermographs interpret the data, showing the results in color floor plans that can be easily understood to enable a quick understanding of facility-wide comfort and operating conditions.
  • The Automated Logic Fault Detection and Diagnostics (FDD) library in the WebCTRL building automation system can pinpoint over 100 proven faults in typical HVAC equipment. It helps users by measuring, anticipating, providing insight, and automatically responding to system conditions that are not necessarily critical, but may be trending that way – all with the goal of improved performance.
  • The revolutionary Time-lapse™ feature within the WebCTRL system allows operators to roll back time, up to a 24- hour slice, and play back hours of realtime data in just minutes. Floor plans, equipment graphics, trends, and alarms over a past period of time can be accessed easily enabling quick identification, review, and resolution of building control issues.
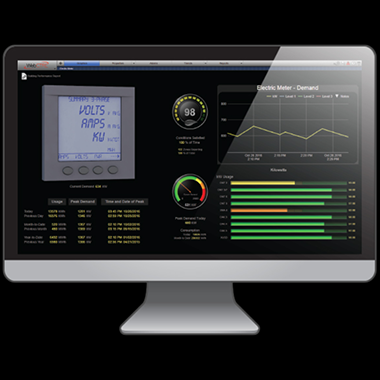
  • Advanced Reporting through the EnergyReports platform facility managers can take advantage of a flexible, easy-to-use reporting tool that enables them to produce a wide variety of reports showing a building’s energy consumption.
  • Monitoring and storing your energy data, we make it easy for authorized users to view and archive energy usage data in order to help manage utility consumption.
  • Every WebCTRL system supports live, visual displays of control logic, which uses real time operational data and aids in optimizing and troubleshooting system operations. There is no need to understand cryptic “line by line” computer code.
  • Customizable dashboards provide operators with standard KPIs such as energy consumption, the Environmental Index™, triggered faults and a breakdown of FDD alarms by category.
  • Supports customized, graphically displayed schedules for buildings, floors, zones or equipment groups to manage.
  • Enables operators to track and troubleshoot building conditions.
  • Alarm conditions are graphically represented and sorted by source, type, and criticality. Managers can easily program and generate alarms that notify users after specified events have occurred.

Documentation

Intuitive Graphical Control

The WebCTRL building automation system offers users efficiency and productivity all in one streamlined interface. Our system converts building data into powerful visualizations that can be interpreted quickly – so operators can act quickly. As a result, our system can keep occupants more comfortable, safe and secure, while optimizing building operations.

Thermographic Color Floor Plans

Thermographic floor plan displays allow instantaneous recognition of building and zone conditions. Rather than interpreting setpoints and calculations, Automated Logic thermographs interpret the data, showing the results in color floor plans that can be easily understood.

Fault Detection and Diagnostics (FDD)

The Automated Logic Fault Detection and Diagnostics (FDD) library in the WebCTRL® system can pinpoint over 100 proven faults in typical HVAC equipment, including VAV systems, air handlers, fan coils, unit ventilators, water-source heat pumps, and air-source heat pumps.

Time-lapse™ Graphics

The revolutionary Time-lapse™ feature within the WebCTRL system allows operators to roll back time, up to a 24-hour slice, and play back hours of realtime data in just minutes. View floor plans, equipment graphics, trends, and alarms over a past period of time so you can quickly identify, review, and resolve building control issues.

Advanced Reporting

Operators can bring building data to life using a variety of graphs in reports and dashboards, making data easy to absorb and comprehend. Calculations can be applied to data before reports are generated to provide additional insight, and scheduling capabilities allow reports to be easily shared with other stakeholders throughout the organization. Standard report templates are available for the most common reporting needs, including energy consumption, alarm conditions and indoor environmental conditions.

Monitoring and Storing Your Energy Usage Data

With WebCTRL you can manage your facilities’ utility consumption, tracking data and usage habits. Monitor the demand, current usage in comparison with the previous day, the current month’s usage in comparison with the previous month or the current year side by side with the previous year.

View and Adjust Control Logic

Simplify and document your system sequences with Eikon, our object-oriented approach to control logic. Created specifically for building control applications, EIKON offers sophisticated programming features to make your building operation simple and energy efficient. Our library of pre-engineered solutions comprises advanced control algorithms and can easily be tailored to your building's mechanical HVAC systems, ensuring precise control and comfort.

Trend and Scatter Plot Tools

With our high-speed architecture and distributed trend gathering, all physical parameters, such as temperature, relative humidity, dew point, CFM and pressure, are historically trended and securely stored. In addition, all environmental data, both current and historical, can be shown in a tabular or graphical display. Our scatter plot displays deliver a firsthand diagnostic perspective on your major equipment, allowing you to assess system efficiency versus load to further optimize your operation.

Reviews

There are no reviews yet.

Be the first to review “WebCTRL® Building Automation System”